CrimeMap SD
Geospatial Visualization
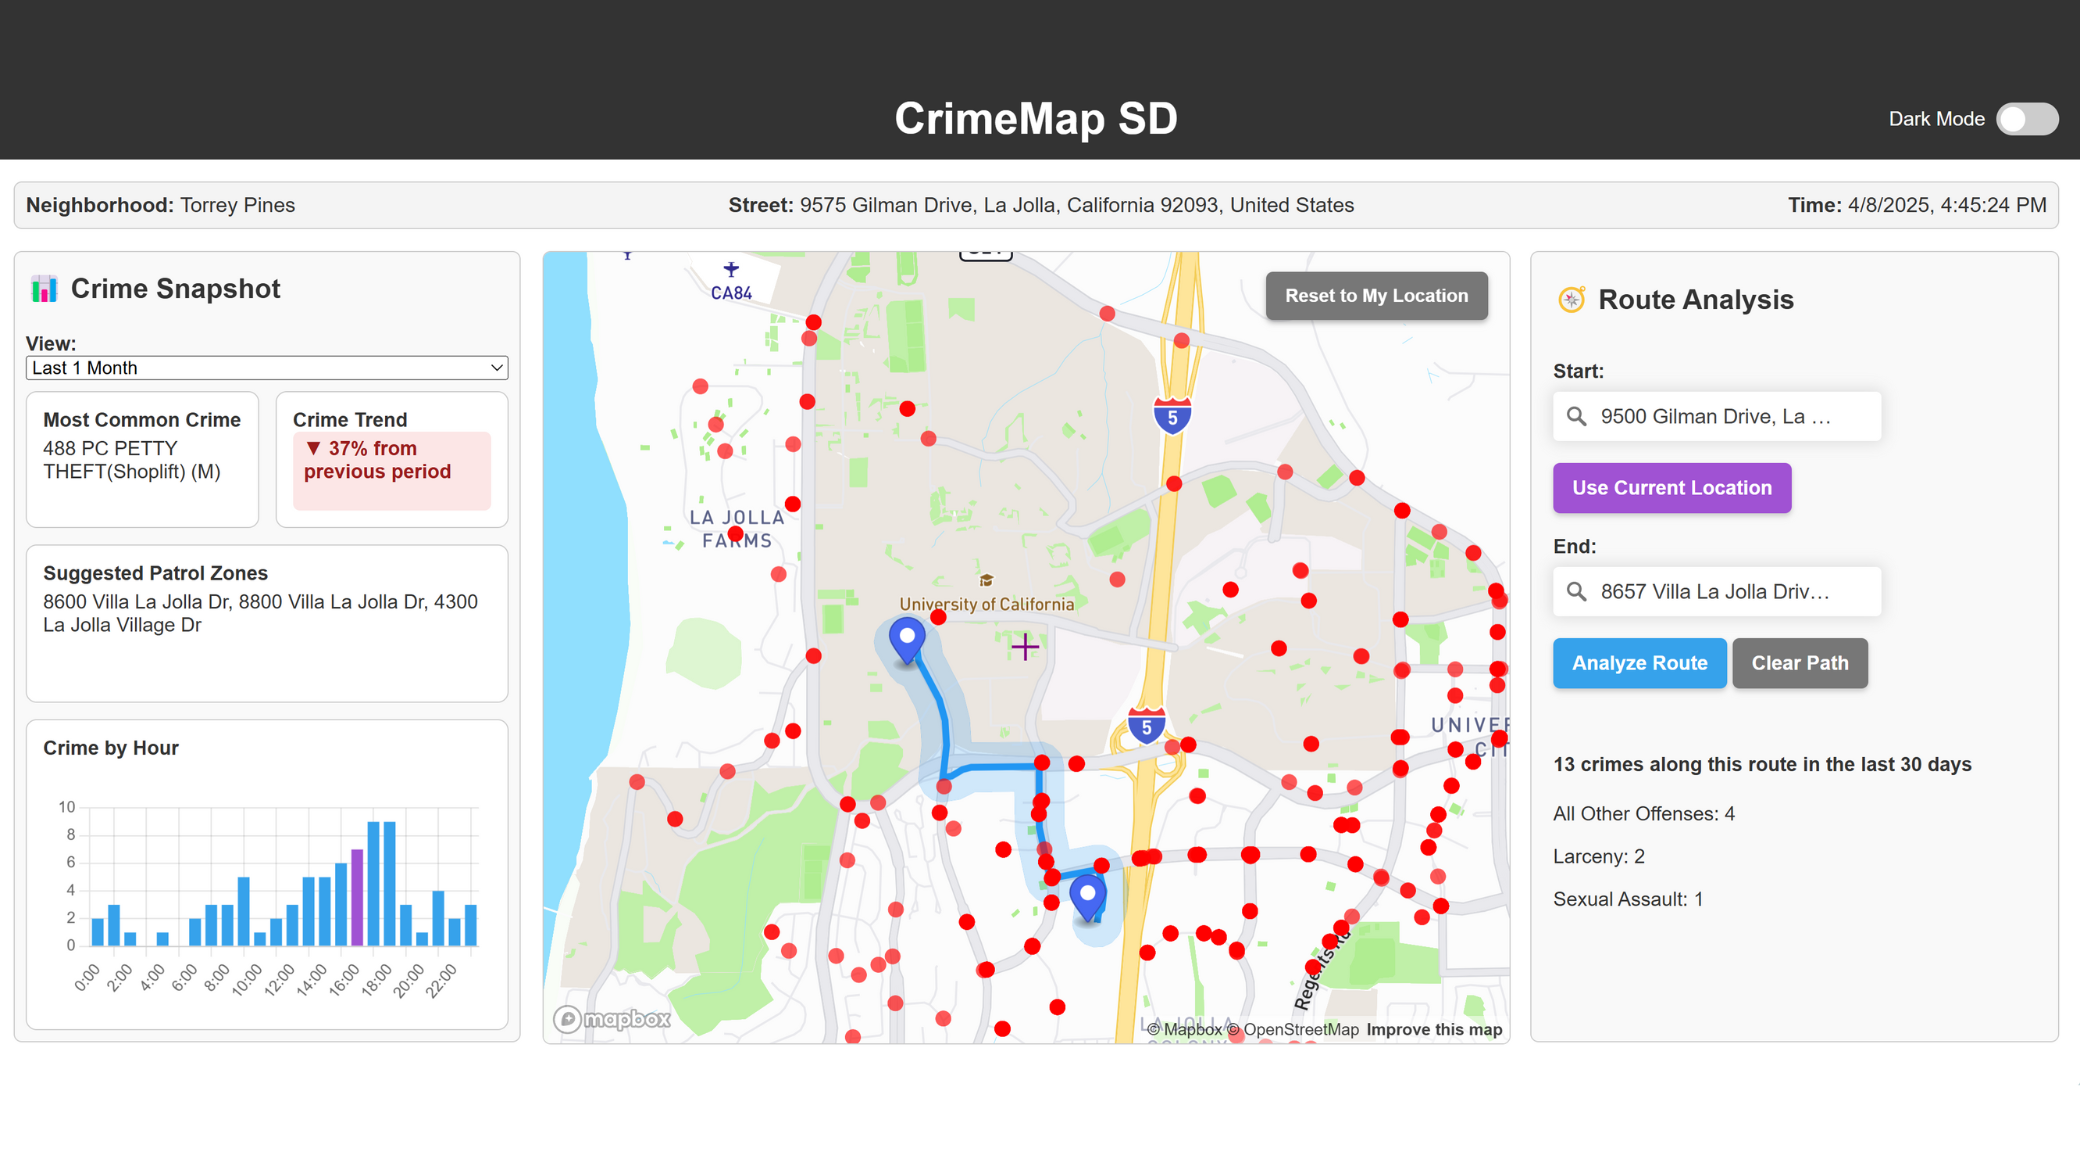
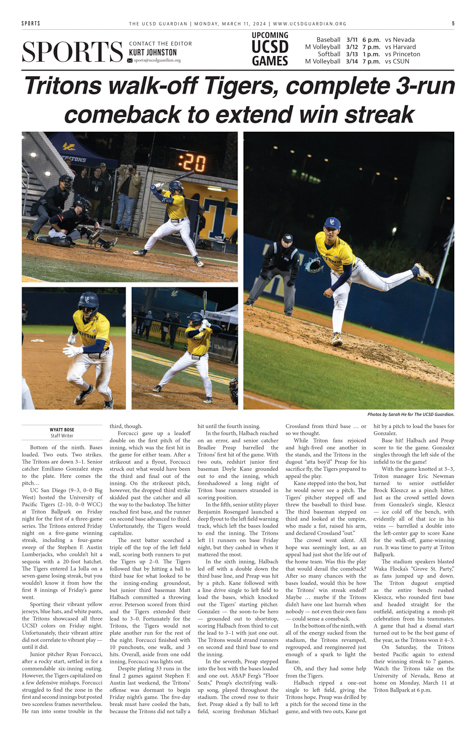
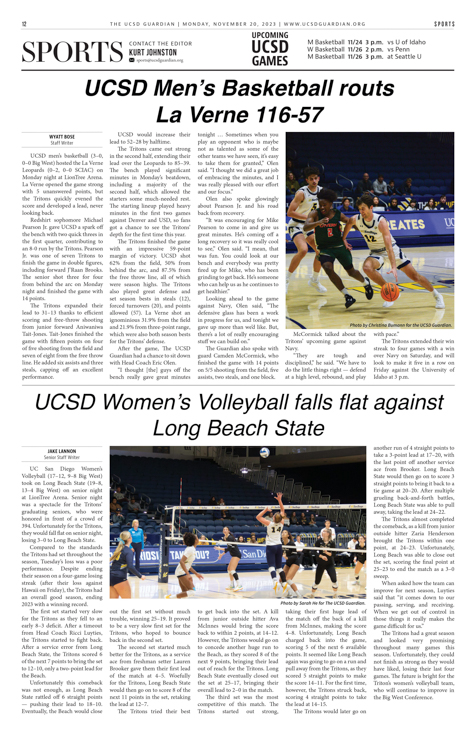
I developed a GPS-centered dashboard that visualizes real-time and historical crime data from the San Diego Police Department,
designed for use in patrol vehicles. Built with JavaScript, Mapbox GL JS, and Turf.js, it displays neighborhood-level crime
trends based on the user's current location. I added a route risk awareness feature that highlights crime density along a
selected path using spatial buffers to support tactical patrol decisions. The interface supports touch interaction, dark/light mode,
and dynamic filtering, and is deployed via GitHub Pages for lightweight access.
Major Power Outage Analysis
Machine Learning, Hypothesis Testing
I analyzed power outage data to identify factors driving severity,
focusing on regional and infrastructural influences. Using exploratory data analysis,
feature engineering, and hyperparameter tuning, I developed a logistic regression model predicting
severe outages with 85% accuracy while minimizing bias across climate categories. Additionally,
I conducted permutation testing to assess missingness dependency, evaluate fairness, and uncover key trends.
EcoMenu
Web Development, Data Analysis, Data Visualization
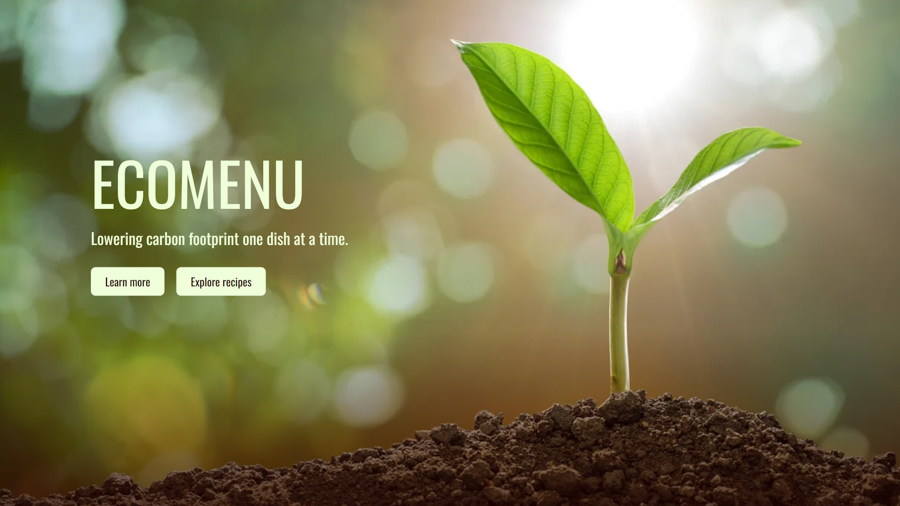
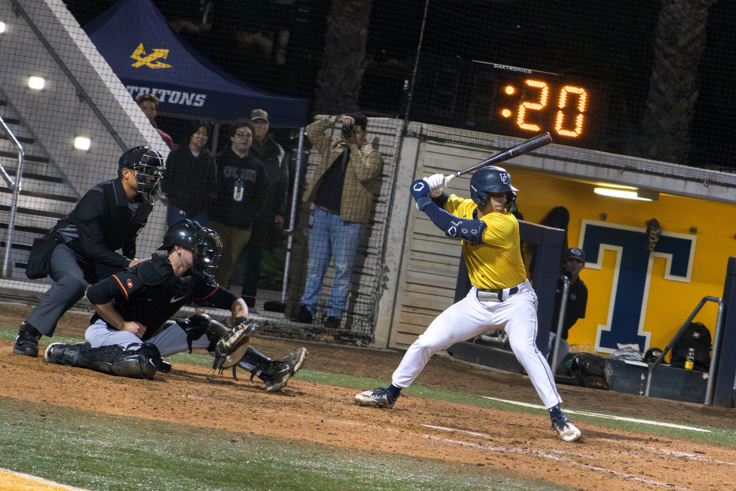
I collaborated with two teammates to develop this recipe recommendation platform that
suggests users with sustainable recipes based on the carbon footprint of their ingredients. I sourced and cleaned
datasets on the carbon footprint of over 350 food ingredients and 2100 recipes. I contributed to the frontend development
of the web application and presented visualizations to showcase insights from the recipe and ingredient data.
San Diego Crime Analysis
Data Analysis, Data Visualization
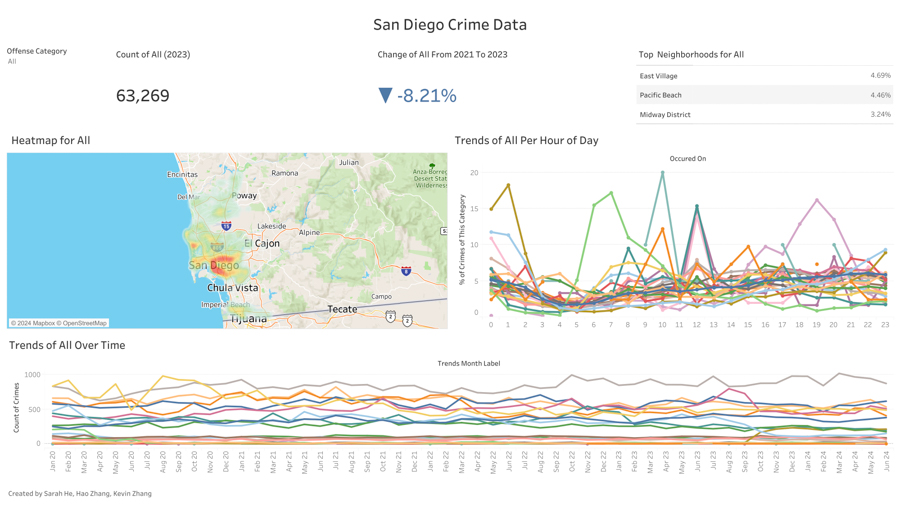
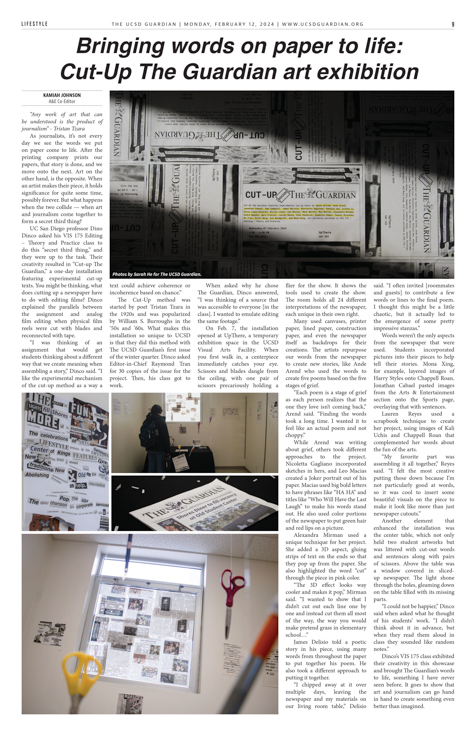
I cleaned and analyzed data from San Diego Police Department to identify trends
that are present in San Diego crimes over the past 4 years. Using Tableau, I created a dashboard to highlight
summary statistics and relevant trends, while allowing users to filter through crime types and get
information specific to those categories.
Starry Sticker Shop Analysis
Data Analysis, Data Visualization
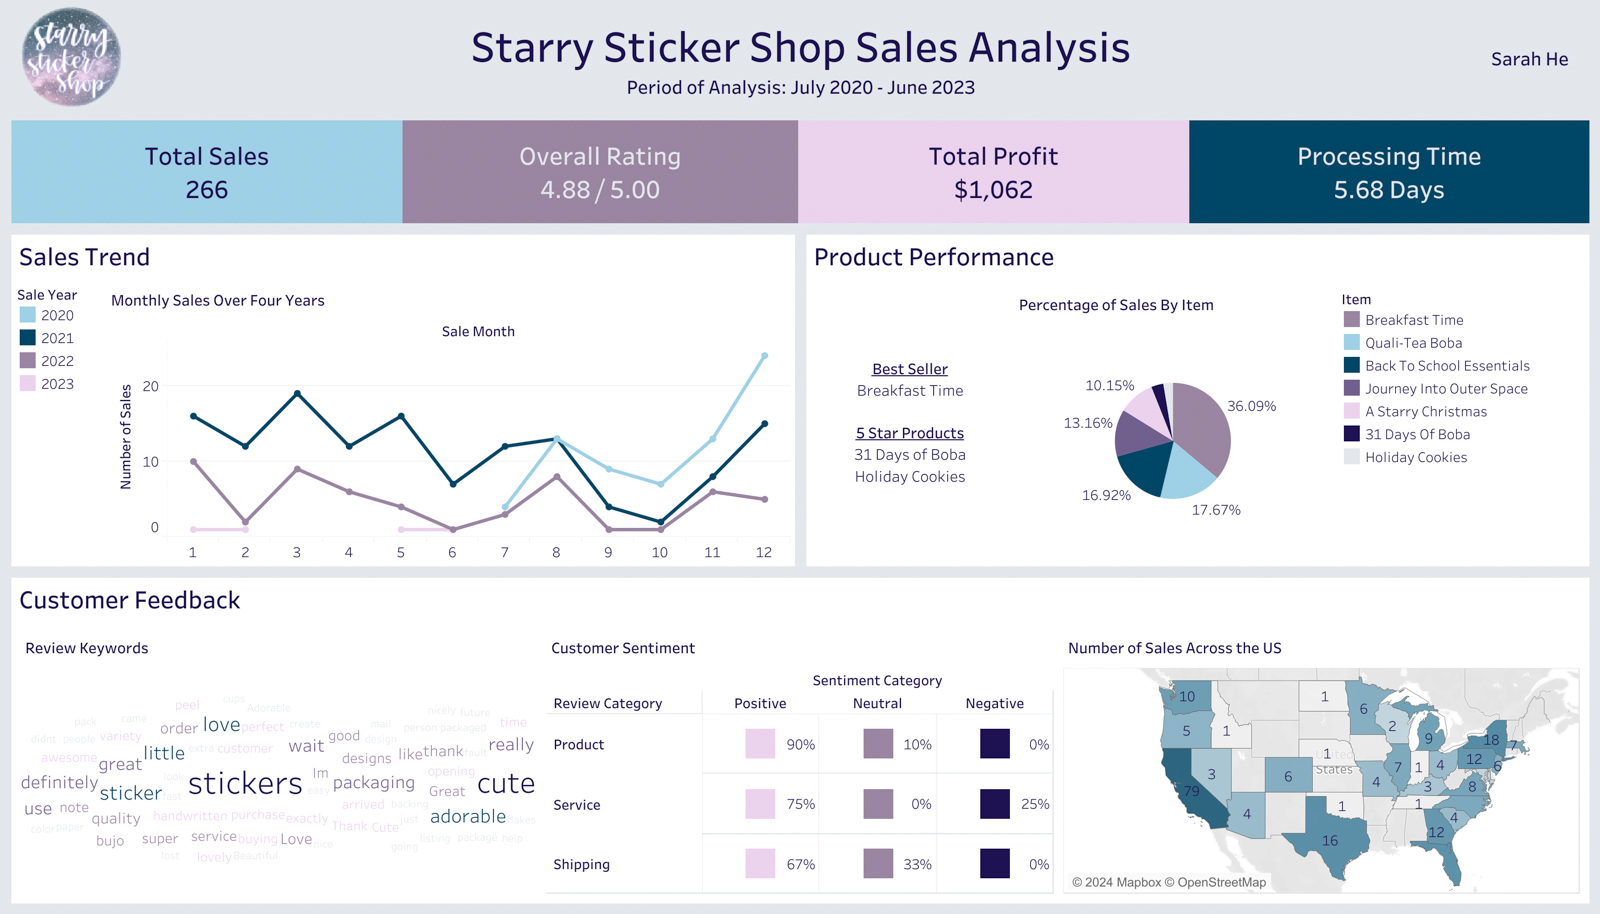
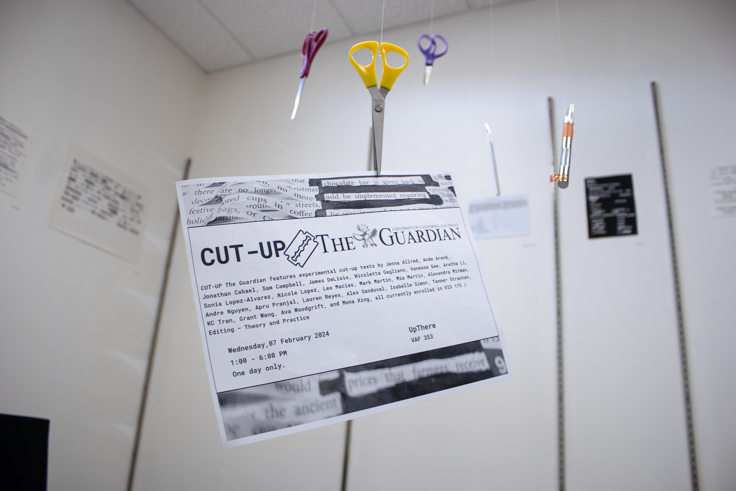
Using Python, I analyzed online shop data from the small business I co-founded to
assess sales patterns and customer sentiment. I then created interactive visualizations using Python
and Tableau to showcase shop performance.
Portfolio Website
Web Development
This website here! I built and designed everything you see on this page from
scratch using HTML/CSS and JavaScript.
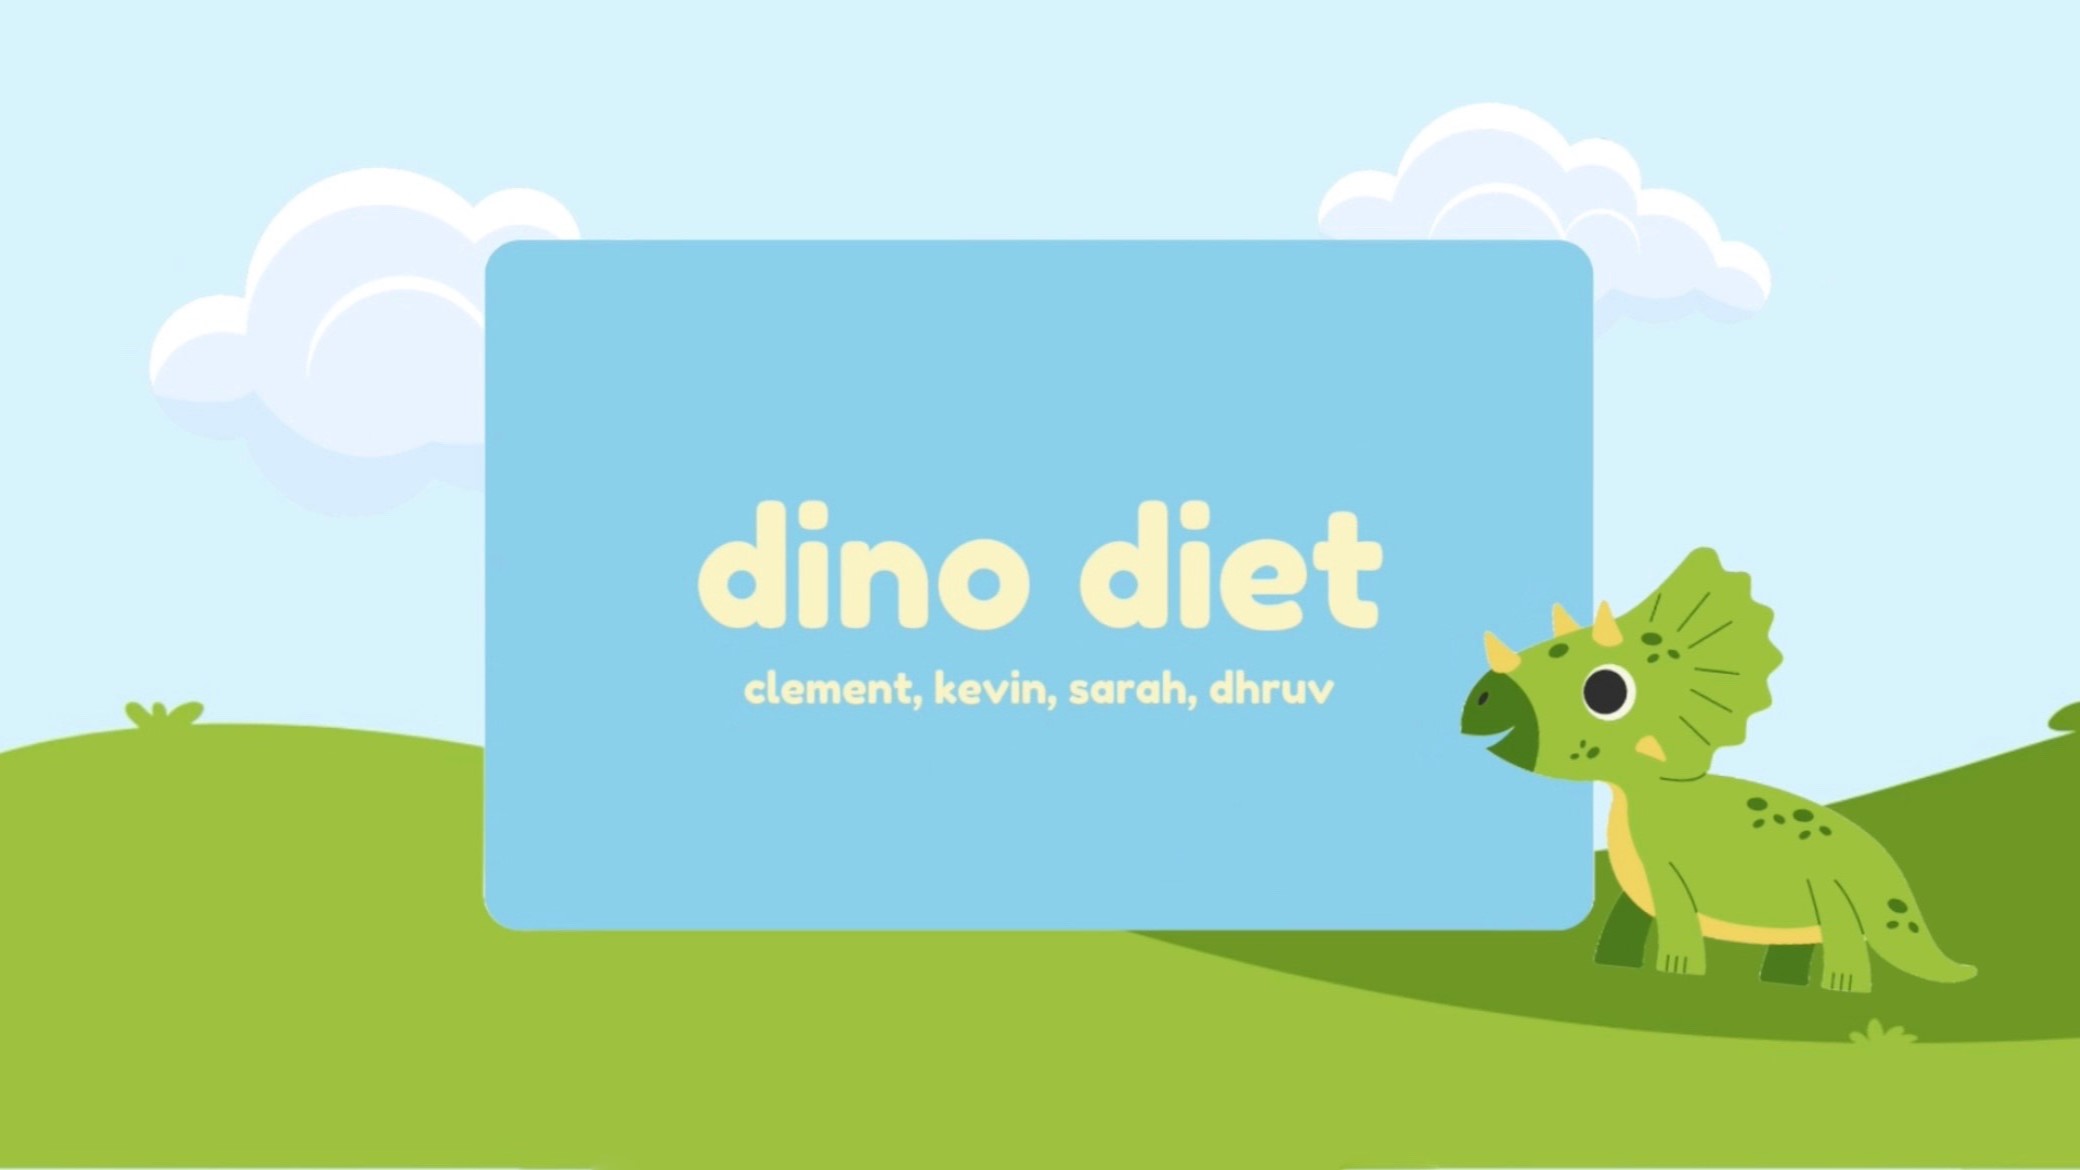
Dino Diet
Machine Learning, Web Development
At DataHacks, my team and I implemented a XGBoost classifier
that would predict the diet of a dinosaur based on four features with 93% accuracy. We developped a Flask
application for users to selected their own dinosaur features along with data visualizations on
our webpage to showcase our statistics.
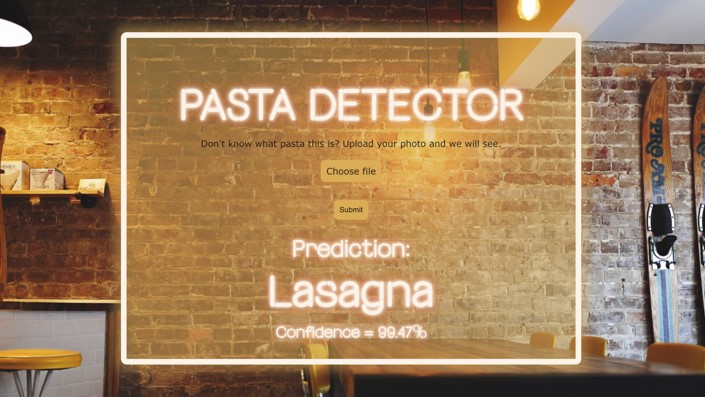
Pasta Detector
Machine Learning, Web Development | February 2024
At FullyHacks, I worked in a team of 3 to develop an image
classification web application to distinguish between different pasta types. We trained a
machine learning model to classify pasta images and implemented a frontend web page for users
to upload their own photos.